
What is SuperAreas.com Support and Resistance Areas
Precision. Structure. Professional Futures Trading.
Historic Daily Areas
How we predict
Browse 10 Morning and 10 Evening area sheets — including Morning & Evening of September 14, 2026 — plus other dates from the last year.
Morning Areas (Mon-Thu) (Futures) | Monday | Sep,14,2026 |
These areas are not Buy or Sell areas and not any financial advice at all! |
| BASE |  | | | | |  | | | | | | | | | |
| PRESSURE | | | | | | | | | | | | | | | |
| HIGH Strike price | 29300 | 2920 | 4450 | 0.72600 | 1.1640 | 1.3500 | 25550 | 6.6100 | 66.400 | 79400 | |||||
| LOW Strike price | 7660 | 52150 | 98.40 | 2.500 | 2440 | ||||||||||
| Current Contract Month | Sep 26 | Sep 26 | Sep 26 | Sep 26 | Dec 26 | Oct 26 | Oct 26 | Dec 26 | Dec 26 | Dec 26 | Sep 26 | Dec 26 | Dec 26 | Aug 26 | Aug 26 |
| MARKET Symbol (Exchange) | S&P 500 ES (CME) | DOW YM (CBOT) | NASDAQ NQ (CME) | Russell 2K RTY (CME) | Gold GC (COMEX) | Crude Oil CL (NYMEX) | Natural Gas NG (NYMEX) | CADUSD (6C.CME) | EURUSD (6E.CME) | GBPUSD (6B.CME) | FDAX (Eurex) | Copper HG (COMEX) | Silver SI (COMEX) | Crypto BTC (CME) | Crypto ETH (CME) |
| Extreme High | 7722 7710 | 53420 53350 | 29500 29430 | 2960 2950 | 4500 4487 | 110.70 110.00 | 3.090 3.050 | 0.72840 0.72760 | 1.1670 1.1660 | 1.3600 1.3890 | 25840 25800 | 6.7300 6.7100 | 68.200 67.500 | 83800 82400 | 2740 2720 |
| Expected High | 7683 7670 | 52930 52840 | 29380 29300 | 2933 2921 | 4428 4415 | 106.20 105.40 | 3.000 2.960 | 0.72600 0.72500 | 1.1630 1.1620 | 1.3545 1.3530 | 25600 25560 | 6.5900 6.5600 | 66.000 65.000 | 80600 80100 | 2640 2610 |
| Intraday TARGET R2 | 7653 7649 | 52730 52700 | 29200 29170 | 2913 2911 | 4400 4396 | – – | – – | – – | – – | – – | – – | – – | – – | – – | – – |
| Intraday TARGET R1 | 7636 7632 | 52620 52590 | 29120 29090 | 2906 2904 | 4390 4386 | – – | – – | – – | – – | – – | – – | – – | – – | – – | – – |
| Intraday TARGET S1 | 7604 7600 | 52430 52400 | 28940 28910 | 2892 2890 | 4346 4342 | – – | – – | – – | – – | – – | – – | – – | – – | – – | – – |
| Intraday TARGET S2 | 7595 7591 | 52300 52270 | 28830 28800 | 2882 2880 | 4304 4300 | – – | – – | – – | – – | – – | – – | – – | – – | – – | – – |
| Expected Low | 7568 7555 | 52090 52000 | 28720 28630 | 2872 2860 | 4280 4267 | 100.00 99.20 | 2.820 2.880 | 0.72100 0.72000 | 1.1580 1.1565 | 1.3460 1.3420 | 25360 25310 | 6.3500 6.3200 | 62.400 61.600 | 75700 75200 | 2430 2400 |
| Extreme Low | 7512 7500 | 51640 51570 | 28450 28370 | 2843 2833 | 4200 4190 | 95.70 95.00 | 2.740 2.700 | 0.71900 0.71830 | 1.1540 1.1530 | 1.3400 1.3390 | 25090 25050 | 6.1800 6.1600 | 60.000 59.400 | 73500 73100 | 2340 2320 |
Evening Areas (Futures) | Monday | Sep,14,2026 |
These areas are not Buy or Sell areas and not any financial advice at all! |
| BASE | – | – | – | – | – | – | – |
| PRESSURE | – | – | – | – | – | – | – |
| HIGH Strike price | – | – | – | – | – | – | – |
| LOW Strike price | – | – | – | – | – | – | – |
| Current Contract Month | Dec 26 | Sep 26 | Dec 26 | Sep 26 | Dec 26 | Oct 26 | Oct 26 |
| MARKET Symbol (Exchange) | S&P 500 ES (CME) | DOW YM (CBOT) | NASDAQ NQ (CME) | Russell 2K RTY (CME) | Gold GC (COMEX) | Crude Oil CL (NYMEX) | Natural Gas NG (NYMEX) |
| Extreme High | – – | – – | – – | – – | – – | – – | – – |
| Expected High | 7753 7740 | 53000 52920 | 29790 29700 | 2932 2920 | 4410 4395 | 105.70 104.90 | 2.980 2.940 |
| Intraday TARGET R2 | – – | – – | – – | – – | – – | – – | – – |
| Intraday TARGET R1 | – – | – – | – – | – – | – – | – – | – – |
| Intraday TARGET S1 | – – | – – | – – | – – | – – | – – | – – |
| Intraday TARGET S2 | – – | – – | – – | – – | – – | – – | – – |
| Expected Low | 7660 7646 | 52170 52100 | 29100 29000 | 2876 2865 | 4285 4270 | 100.00 99.10 | 2.820 2.780 |
| Extreme Low | – – | – – | – – | – – | – – | – – | – – |
Historic areas for educational illustration only. These are not buy/sell signals or financial advice. Members get the full historic Morning & Evening archive inside the portal.
About SuperAreas.com
SuperAreas.com is a professional futures trading education platform built on one simple mission:
Our Mission
Teach traders how to read the market the way institutions do — with clarity, structure, and confidence.
Founded in 2008 and trusted by 12,000+ Globally Trained Students, SuperAreas combines:
- Real price action
- Multi-timeframe market structure
- Institutional logic
- Our signature SuperAreas™ Support & Resistance Zones
to help traders understand where the market is likely to react, why, and how to take advantage of it safely and systematically.
What We Are NOT
- We are not a signals service.
- We are not a robot.
- We do not sell automation or "get rich quick" dreams.
SuperAreas is a true education institute where professional mentors teach:
This is how traders learn to grow — consistently, responsibly, and intelligently.
What We Do
We reveal the roadmap of the markets — the same way institutions see it.
Every trading day, our team analyzes:
30-Minute Charts
Precision intraday structure
60-Minute Charts
Swing structure
240-Minute Charts
Macro institutional levels
From this, we generate SuperAreas™ Zones:
Support Areas
S1 to S4 = Major Support Areas
Resistance Areas
R1 to R4 = Major Resistance Areas
These zones are where:
- Liquidity builds up
- Institutions place orders
- Retail gets trapped
- Reversals happen
- Breakouts fail
- High-probability setups occur
Why Our Zones Work
Our zones match institutional logic almost perfectly because they are built from the same components:
- Multi-timeframe structure
- Liquidity sweeps
- Rejection wicks
- Compression → expansion patterns
- Imbalances (FVG)
- Historical reaction points
- Session behavior
- Volatility shifts
SuperAreas does not predict the future.
It identifies where institutions MUST do business.
When you understand the business zones of the market, you no longer guess — you plan.
Tick Charts for Scalping & High-Frequency Trading
SuperAreas.com algorithm also works exceptionally well with tick charts for scalping and high-frequency trading (HFT) strategies.
Scalping with Tick Charts
Tick charts provide a different perspective on market structure — they show price movement based on the number of trades rather than time. This makes them ideal for:
- Scalping — capturing quick moves of just a few ticks
- High-Frequency Trading (HFT) — identifying rapid entry and exit points
- Precision entries — getting into trades at optimal micro-levels
Our SuperAreas algorithm helps identify key levels on these scalping tick charts:
403 Tick
Ultra-fast scalping
805 Tick
Fast scalping
1510 Tick
Medium scalping
3020 Tick
Standard scalping
6040 Tick
Extended scalping
How Tick Charts Enhance SuperAreas
When combined with our SuperAreas algorithm, tick charts reveal:
- Micro-level support and resistance zones
- Precise entry points for scalping
- Quick reversal opportunities
- HFT entry/exit signals
- Liquidity clusters at tick levels
- Rapid price action reactions
Professional Scalping Approach
Whether you're scalping for a few ticks or executing HFT strategies, SuperAreas zones on tick charts help you identify where price is most likely to react — giving you the edge to capture quick moves with precision and discipline.
How We Predict
We don't predict direction — we predict where direction will matter.
What Most Traders Try to Guess
- "Up or down?"
- "Buy or sell?"
- "Bullish or bearish?"
At SuperAreas, We Teach a Professional Approach
The market doesn't move randomly. It moves from one area of liquidity to the next.
We use a structured, institutional-style process:
Identify Major Market Structure
We break down the chart into:
- Swings
- Highs/lows
- Impulses
- Corrections
- Expansion/compression
- Higher timeframe bias
This lets us understand the context behind price movement.
Map High-Probability Reaction Zones (SuperAreas)
Using 30m, 60m, and 240m charts, we mark where:
- Banks and hedge funds place large orders
- Stop losses are clustered
- Rebalancing happens
- Algo traps are created
- Previous imbalances need filling
These are predictable business zones where big money acts.
Look for Institutional Behavior
We monitor signs of:
- Liquidity sweeps
- Failed breaks
- Sharp rejections
- Absorption
- Aggressive ordering
- Volatility shifts
This tells us how price is interacting with the zone.
Execute With Clear Rules
When price reaches an S1–S4 or R1–R4 zone, we look for:
- Rejection
- Follow-through
- Trend continuation
- Reversal confirmation
We do not chase the market. We wait for reaction, then act with discipline.
Probability, Not Prediction
We don't claim to know:
- The exact top
- The exact bottom
- Or the exact next candle
What we know with high accuracy is:
"When price reaches this zone, there is a high probability something important will happen."
That's the edge. That's how professionals trade. And that's what we teach.
SuperAreas in One Sentence
“We teach traders to trade like institutions by understanding how the market truly moves — from zone to zone, liquidity to liquidity, structure to structure.”
JOIN TODAY and learn the way professionals trade!
Ready to transform your trading? Join 12,000+ Globally Trained Students who have learned to trade like institutions.
Areas Only Subscription Plans
Every plan includes the same Super Areas, 1+ years of historic Morning and Evening levels, live sessions, tools, and support. Longer plans cost less per month.
1 Week
Try the levels and live floor before a longer commitment.
1 Month
Full access month to month, with no long lock-in.
3 Months
Better value while you work a prop-firm challenge.
6 Months
For funded traders scaling with a stable monthly cost.
12 Months
Lowest monthly cost for full-time or multi-account traders.
What's included
Daily Super Areas
Morning, Mon–Thu (15 markets): ES, YM, NQ, RTY, CL, GC, NG, 6C, 6E, 6B, FDAX, HG, SI, BTC, ETH
Morning, Friday (7 markets): ES, YM, NQ, RTY, CL, GC, NG
Evening, Mon–Thu + Sunday (7 markets): ES, YM, NQ, RTY, CL, GC, NG
Historic archive: 1+ years of Morning and Evening levels
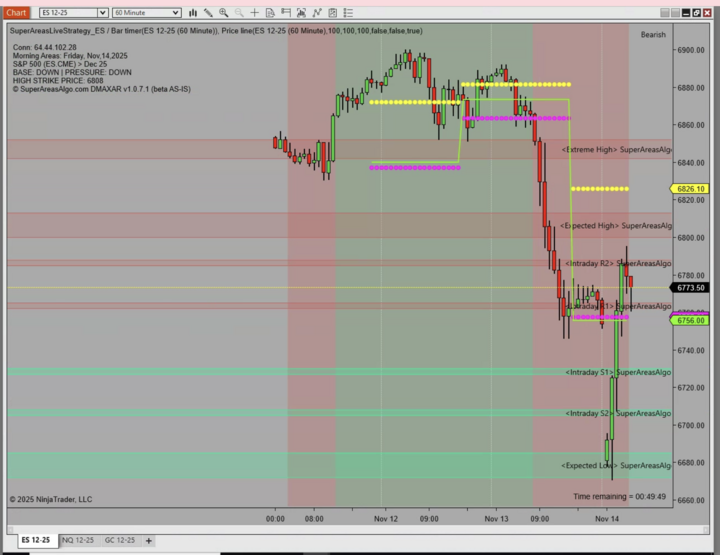
NinjaTrader 8.1 SuperAreas Plotting Tool: Daily Automation on any chart
Live floor & community
- Live audio/video sessions, Monday–Friday
- Saturday seminars and live Q&A
- Daily briefing, Zoom, Telegram, and chat support
- Major news and earnings alerts
Funded-account support
- Coaching, mentorship, and account setup help
- Funded-account discount codes
- USD futures brokerage assistance
- NT8 to MT5 bridge and trade-copier help (NinjaTrader, Tradovate, Rithmic, Quantower)
Tools & guides
- NinjaTrader 8.1 SuperAreas Plotting Tool with Daily Automation on any chart
- Fibonacci, position averaging, stop-loss, tick values, Rithmic threshold
- Trading Journey to $120,000 USD guide
- NinjaTrader futures trial guide
No free trials. Paid subscriptions only.